LM_HM116 black-oil simulation: first complete history run
Prepared 2026-09-21. Simulator: bxuSim. Draft for discussion.
1. Headline
Section titled “1. Headline”The full 45-year history ran to completion on bxuSim: 545 report steps, 853 time steps, 50 minutes 44 seconds of wall clock on 16 parallel processes, clean exit.
| Quantity | Value |
|---|---|
| History window | 1978-03-01 to 2023-08-01 |
| Active cells | 668,529 of 11,937,926 |
| Original oil in place | 1,239.0 MMSTB |
| Original gas in place | 1,399.7 Bscf |
| Original water in place | 4,465.3 MMSTB |
| Cumulative oil at end | 82.62 MMSTB, 6.67% of OOIP |
| Cumulative gas at end | 220.0 Bscf, 15.7% of OGIP |
| Cumulative water at end | 19.35 MMSTB |
| Peak field oil rate | 21,451 STB/d on 2008-04-16 |
| Field average pressure | 5,878 psia at start, 4,120 psia at end |
| Water cut at end | 0.314 |
| Producing GOR at end | 5.57 Mscf/STB |
| Wells | 69 producers in 12 groups |
One qualification applies throughout and is developed in section 8: no reference solution from ECLIPSE has been obtained yet, so these results are internally consistent but not yet cross-validated against a second simulator.
2. The model as received
Section titled “2. The model as received”The deck is a Petrel 2021.5 export. Nothing in the geological or fluid description was altered.
| Item | Value |
|---|---|
| Grid | 178 × 77 × 871 corner-point, 246 ft × 246 ft areal cells, layer thickness 0.24 to 78 ft |
| Active fraction | 5.6%; the active area occupies I = 1 to 86, J = 9 to 68 |
| Depth range | 4,979 to 13,784 ft |
| Fluid | Black oil with dissolved gas, dry gas, five PVT regions |
| Saturation functions | 11 SWOF and 11 SGOF tables, end-point scaling, SWATINIT |
| Initialisation | 689 equilibration regions, each with its own RSVD table |
| Faults | 64 named faults, 931,628 face records; all sealed by MULTFLT except LM_F24, LM_F80A and LM_F81A |
| Threshold pressure | THPRESFT 7,251.89 psi on LM_F24 |
| Wells | 69 producers, 23 VFP tables, history control on liquid rate with BHP limits |
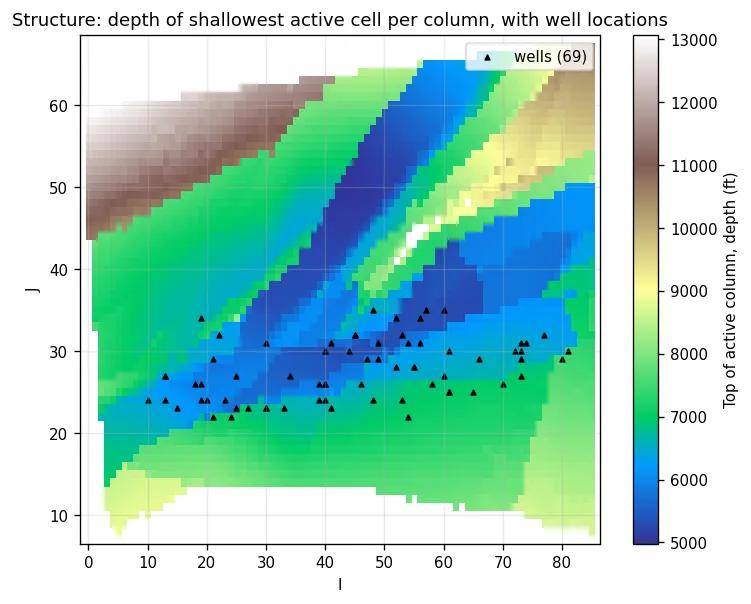

The structure map shows the depth of the shallowest active cell in each column, with well locations. The field is a set of fault-bounded compartments, which is the key to reading the pressure maps in section 5.
3. Changes required to run the deck
Section titled “3. Changes required to run the deck”Four edits. Three have no physical effect; the fourth is discussed in section 8.
| Edit | Reason | Physical effect |
|---|---|---|
Delete PETOPTS | Export-tool-specific keyword with no simulation meaning | None |
Delete LWBP in SUMMARY | Empty LGR well vector written by the export; the model has no LGRs | None |
| PVDG tables 4 and 5, last row: gas viscosity 0.04440 → 0.04454 | The exported table’s last row, an extrapolated point at 11,030 psi, dips by 0.3% against the required monotonic trend | Negligible. The row lies about 5,000 psi above any pressure the model reaches |
THPRESFT on LM_F24 replaced by MULTFLT 'LM_F24' 0 | See section 8. A 7,252 psi threshold on a fault whose pressure difference stays below 2,200 psi on average is a sealed fault in practice | Equivalent within this model’s pressure range; verified in section 8 by direct measurement of cross-fault flow |
Run configuration: 16 parallel processes on a 28-core, 187 GB workstation.
4. Production history
Section titled “4. Production history”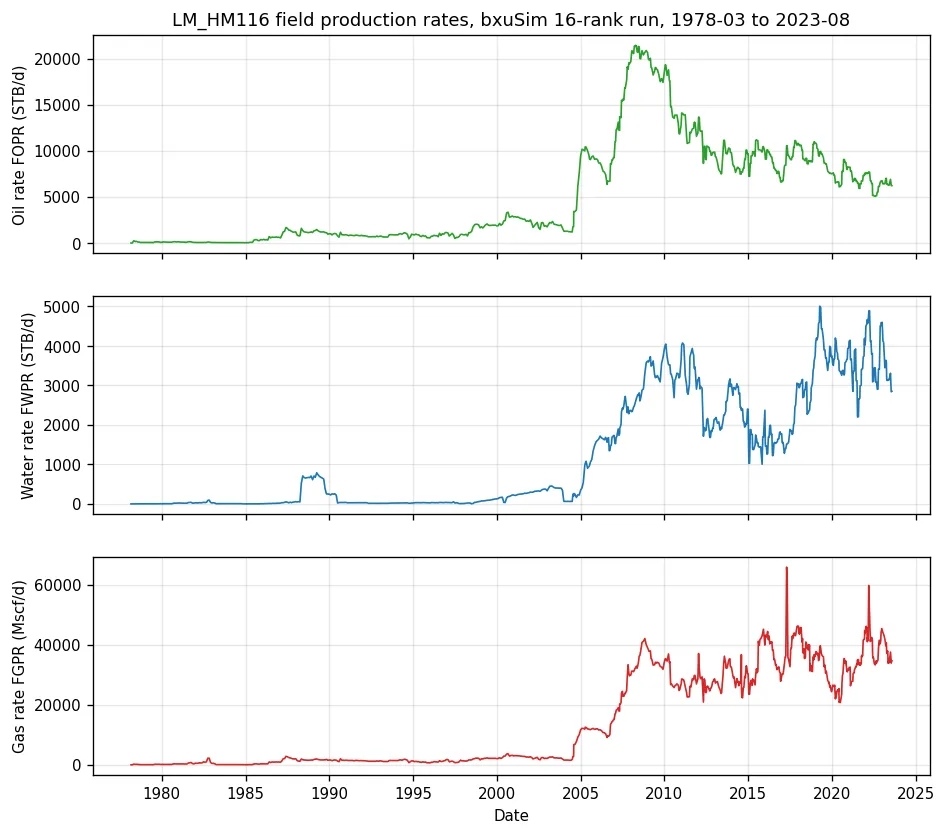
The history has two regimes. From 1978 to 2004 the field produces 200 to 3,500 STB/d from a small number of wells, with a brief water episode in 1988 to 1989. In early 2005 the rate steps up to about 10,000 STB/d, climbs to the 21,451 STB/d peak in April 2008, then declines to 6,500 STB/d by 2023. Water rate rises to 3,000 to 5,000 STB/d after 2010. Gas rate follows oil until 2008 and then holds at 25,000 to 45,000 Mscf/d while oil falls, which is the producing GOR rising from about 1.3 to 5.6 Mscf/STB.
The two isolated gas-rate spikes in 2017 and 2022 are single-time-step events at well control changes. They do not register in the cumulatives.
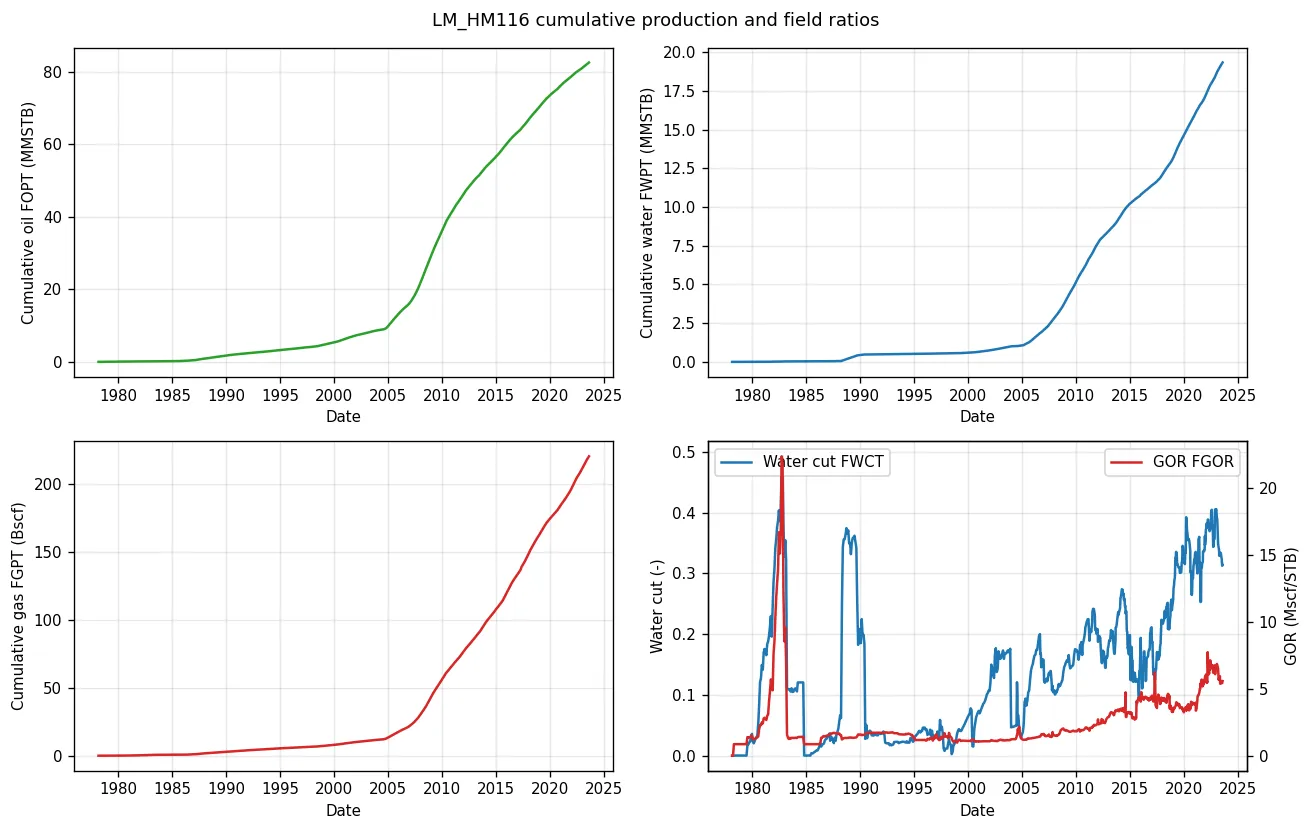
Ninety percent of the cumulative oil is produced after 2005. Water cut climbs steadily from 2005 to 0.31 at the end. GOR shows the classic solution-gas-drive signature: flat near the initial Rs while pressure is above bubble point, then rising once free gas forms.
5. Pressure and fluids in place
Section titled “5. Pressure and fluids in place”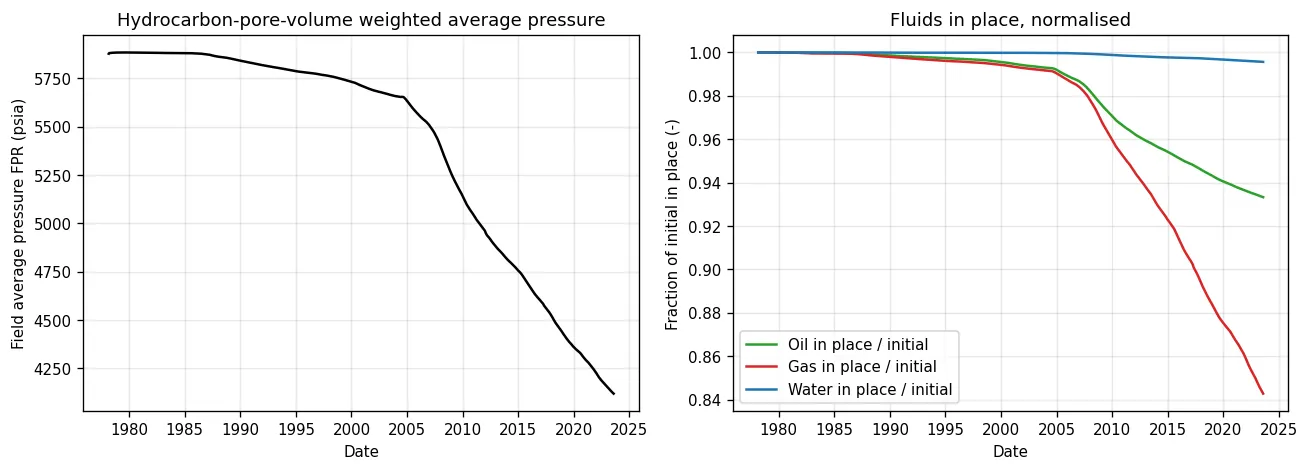
Field average pressure, weighted by hydrocarbon pore volume, holds near 5,880 psia for the first 27 years and then falls 1,760 psi over the last 18. The oil-in-place curve mirrors cumulative oil. Gas in place falls faster than oil in place because liberated gas is produced preferentially. Water in place changes by 0.4%, consistent with a weak aquifer.
Maps and animation
Section titled “Maps and animation”The animation shows the pore-volume-weighted column average of pressure, oil saturation and gas saturation over the active area: one frame every ten report steps plus the final step, 56 frames.
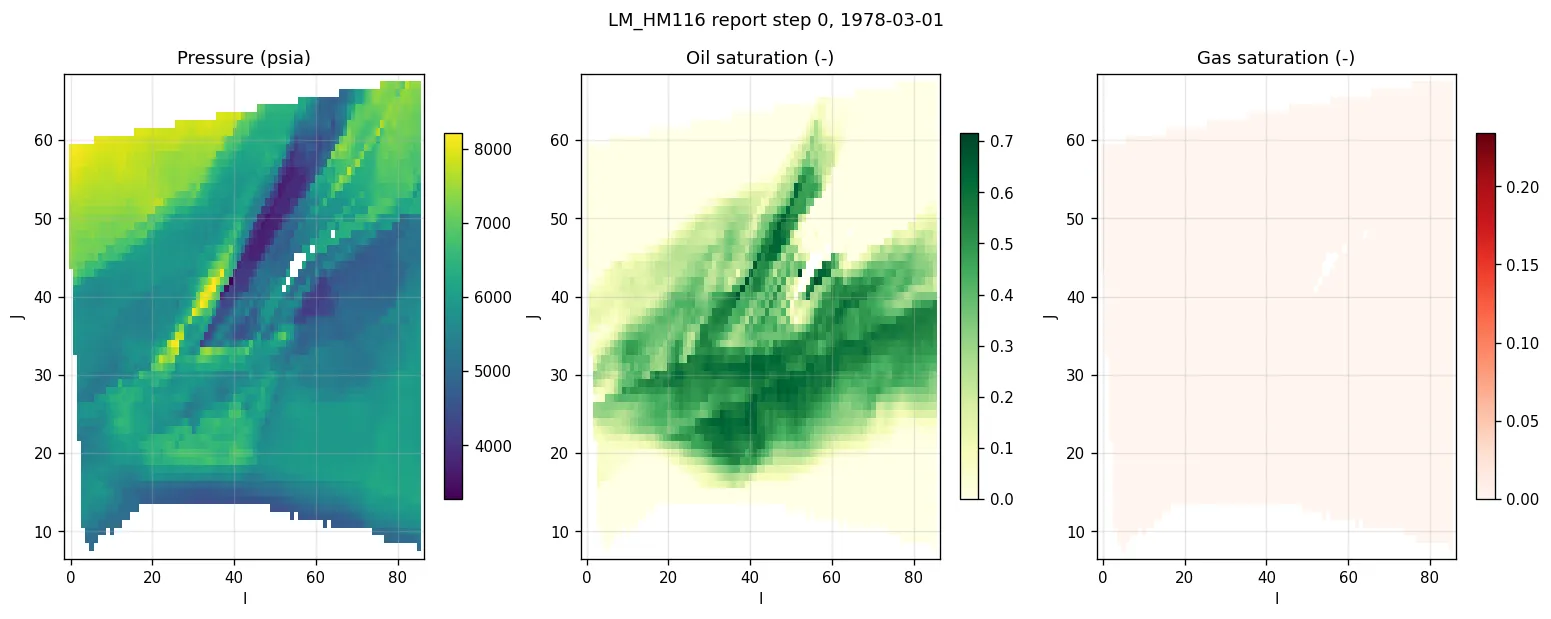
Initial and final states:
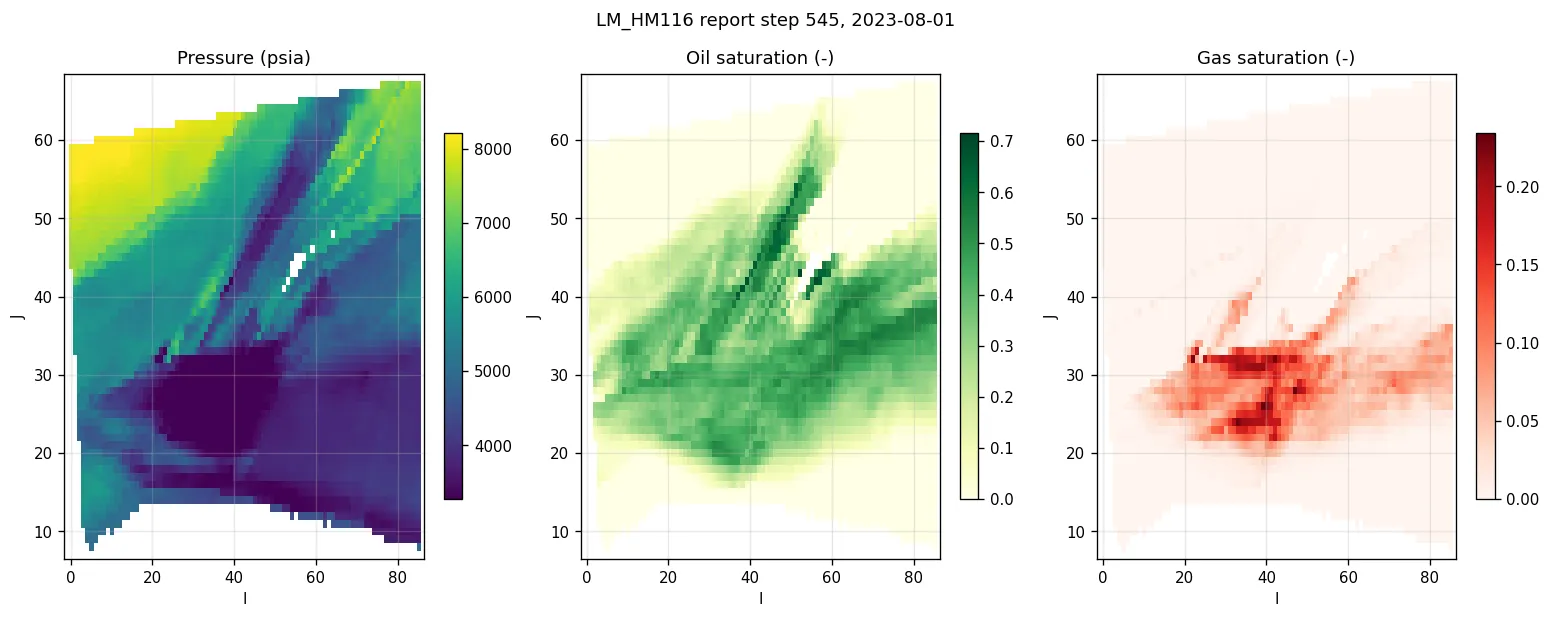
Three features of the final state are worth noting.
Pressure follows the fault compartments. The 2023 pressure map is a patchwork of sharp-edged blocks. The large block around I = 20 to 50, J = 15 to 32 is depleted to 3,300 to 3,600 psia; the north-west corner and the strip along the north-east edge remain above 7,000 psia. The boundaries between blocks are the sealed faults. Compartments without wells stay at initial pressure for the whole history.
Free gas appears where pressure has fallen furthest. Gas saturation reaches 0.2 in the depleted central block and along two north-east trending bands that coincide with the lowest-pressure fault slivers. Elsewhere it stays near zero. This is liberated solution gas, not an initial gas cap.
The remaining oil sits north of the current wells. The two dark green bands at J = 40 to 60 are the north-east trending structure that carries no wells; oil saturation there is still 0.5 to 0.7. The 69 wells cluster on the southern crest at J = 22 to 35, which is exactly where oil saturation has been drawn down and free gas has formed. The map reads as a drainage map: drilled crest depleted and gassy, undrilled structure untouched.
This last point is the most actionable result in the report and deserves a dedicated look before any infill discussion.
6. Wells
Section titled “6. Wells”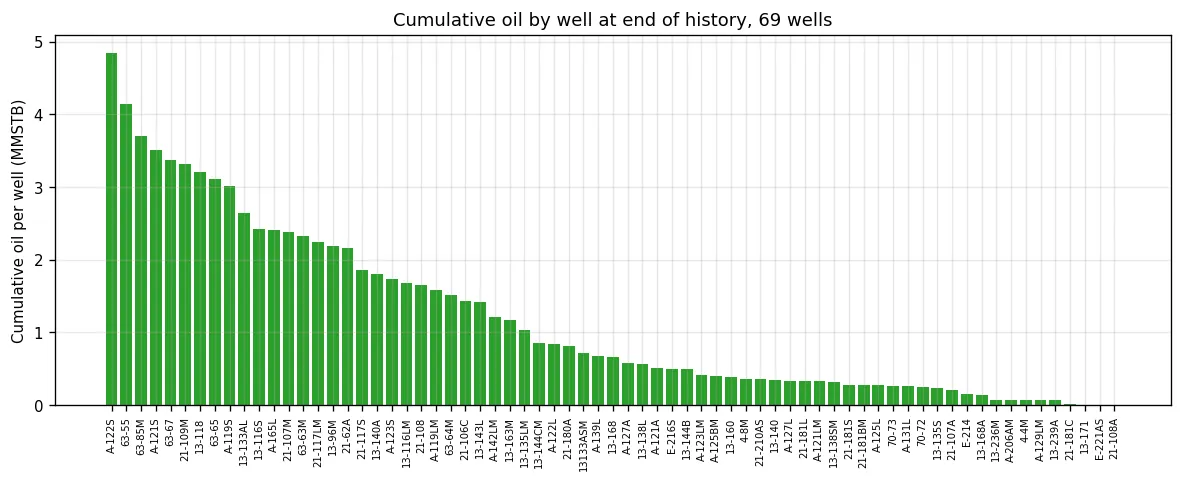
Cumulative oil is spread across the 69 wells with no single dominant producer. The top ten account for 34.9 MMSTB, 42% of the total.
| Well | Cumulative oil, MMSTB |
|---|---|
| A-122S | 4.85 |
| 63-55 | 4.14 |
| 63-85M | 3.70 |
| A-121S | 3.51 |
| 63-67 | 3.37 |
| 21-109M | 3.32 |
| 13-118 | 3.20 |
| 63-65 | 3.11 |
| A-119S | 3.02 |
| 13-133AL | 2.64 |
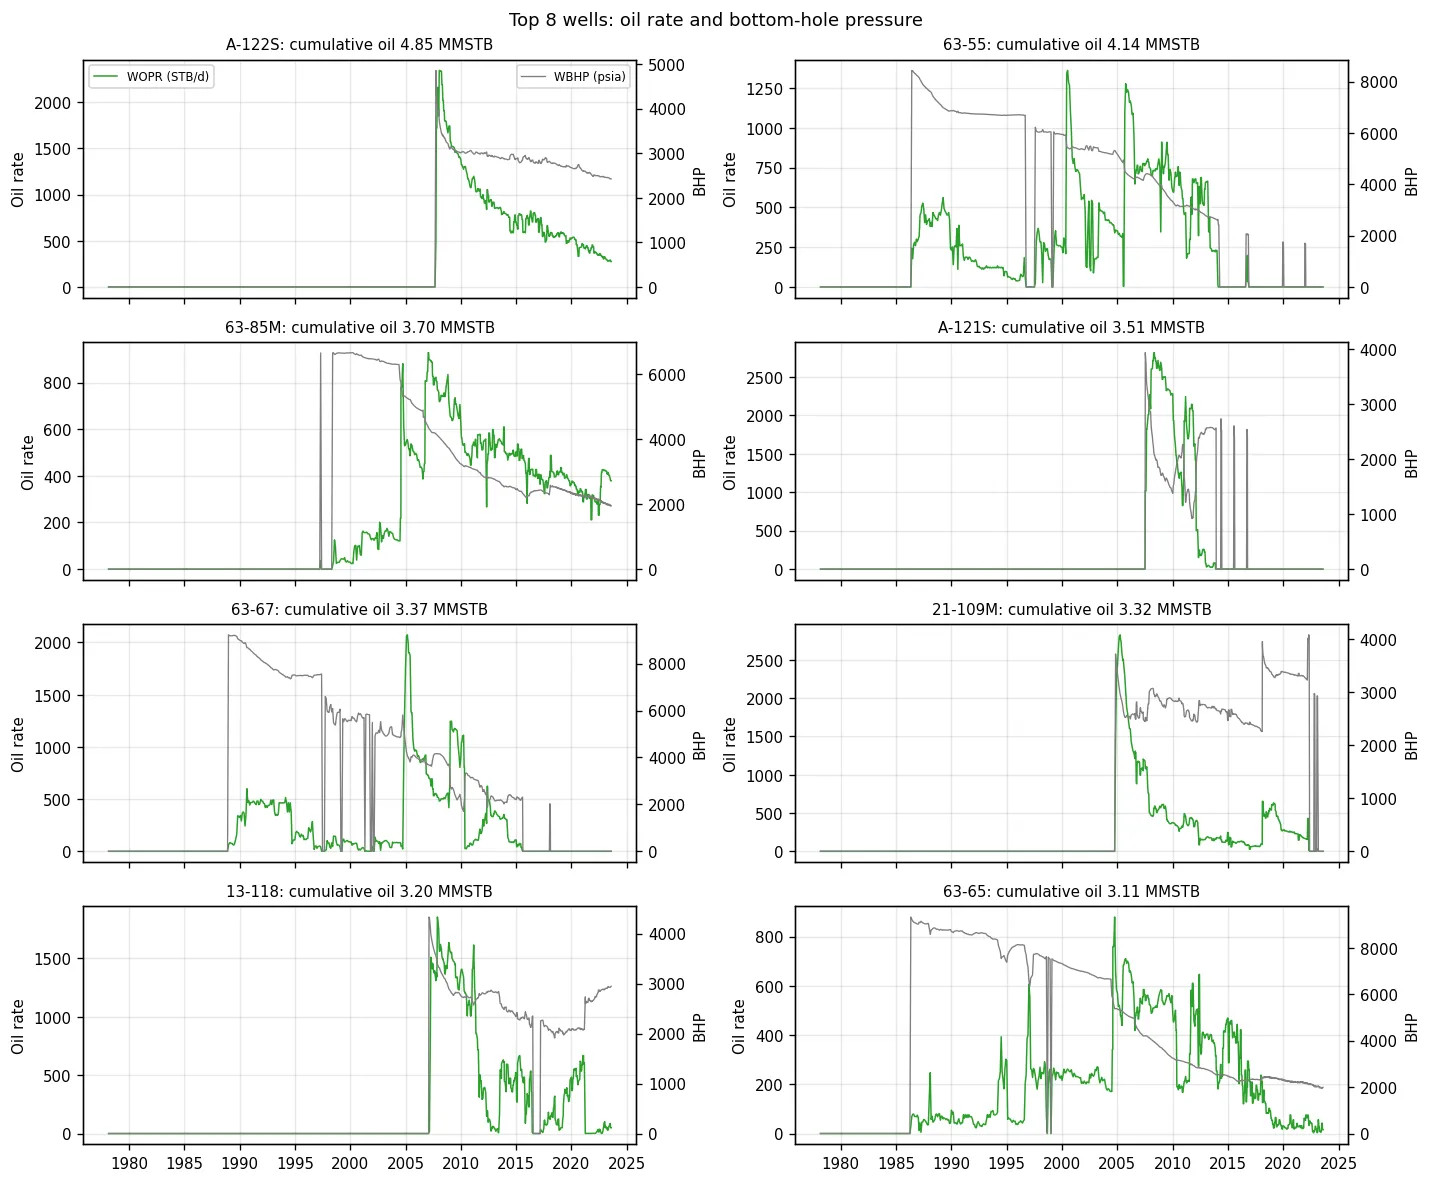
Under history control the oil rates are imposed, so the rate curves are input, not output. What the simulator produces is the bottom-hole pressure needed to deliver those rates. The BHP curves carry the physics: they fall as the compartments deplete, and where a well’s BHP reaches its limit the control switches and the rate becomes an output. The BHP behaviour of the top wells is the first thing to compare against an ECLIPSE reference.
Observed pressures carried in the deck
Section titled “Observed pressures carried in the deck”The history records carry measured tubing-head pressure on 7,436 of the 9,208 well-months, 81%, together with 23 VFP tables. That combination allows a direct check of the match: the simulator computes the bottom-hole pressure needed to deliver each month’s liquid rate, converts it to tubing-head pressure through the well’s VFP table, and that predicted value can be compared with the measured one.
The summary section as exported does not request this comparison. It asks for the observed bottom-hole pressure vector, which is populated on only 5 of the 9,208 records, and does not ask for the observed or predicted tubing-head pressure vectors. Adding WTHP and WTHPH to the summary section costs nothing and turns the measured tubing-head pressures already in the deck into a usable match diagnostic. That change is recommended for the next run.
7. Numerical performance
Section titled “7. Numerical performance”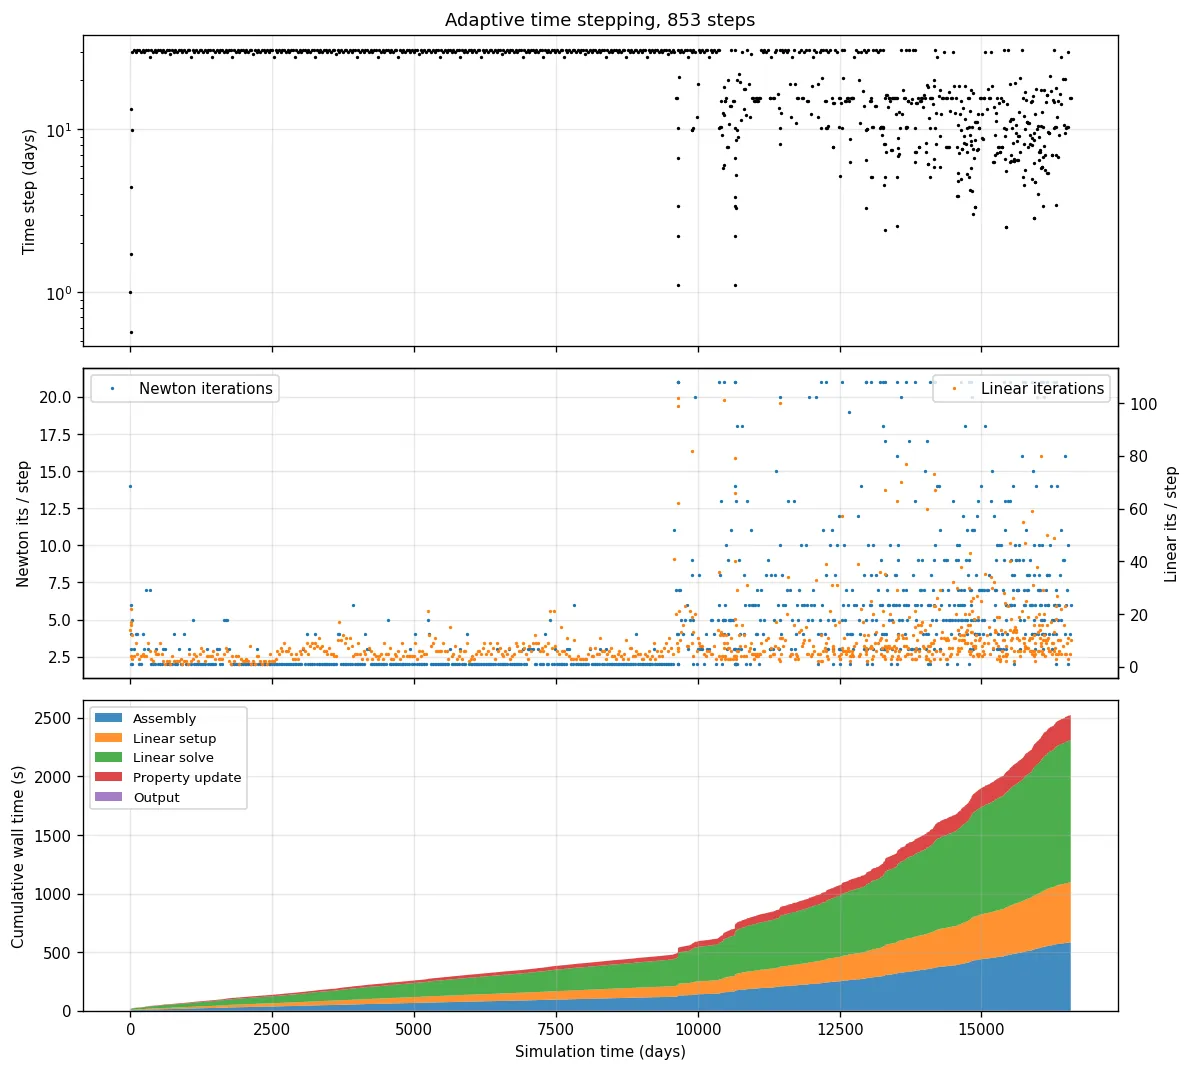
| Item | Value |
|---|---|
| Time steps | 853, of which 40 were chopped and retried |
| Newton iterations | 4,834 total, 16.7% spent on failed steps |
| Linear iterations | 8,880 total, 23.3% spent on failed steps |
| Setup, including deck read | 75.7 s |
| Simulation | 2,958 s |
| Assembly | 582 s |
| Linear solver setup | 513 s |
| Linear solve | 1,214 s |
| Property update | 215 s |
| Output write | 648 s, 21.9% of simulation time |
| Wall clock, launch to exit | 50 min 44 s |
The two production regimes are visible in the solver behaviour. Before 2005 each report step is taken in a single monthly time step with two Newton iterations and under ten linear iterations. After 2005 the steps split to 10 to 15 days, Newton iterations rise to 5 to 20, and linear iterations to 30 to 100. About three quarters of the wall time is spent on the last 40% of the history.
Output cost is high because the deck writes a full restart file at every report step: 546 files totalling 47 GB. For routine work the restart frequency should be reduced to yearly, which brings the output set under 2 GB and removes roughly a fifth of the run time.
Model size and future iterations
Section titled “Model size and future iterations”At 668,529 active cells and close to an hour of wall clock, this model sits above the threshold where iteration speed starts to constrain the workflow. If many history-matching cycles are planned, an upscaled version is worth preparing in parallel. The vertical direction is the obvious candidate: 871 layers at 0.24 to 78 ft thickness, with only 5.6% of cells active, leaves substantial room for layer grouping at little cost to the flow description.
8. The fault threshold pressure, and why it was replaced
Section titled “8. The fault threshold pressure, and why it was replaced”This is the one edit with a physical dimension, so it is documented in full.
What the deck asks for
Section titled “What the deck asks for”THPRESFT 'LM_F24' 7251.89 sets a threshold pressure on fault LM_F24: flow across the fault is blocked until the pressure difference across it exceeds 7,252 psi. The model’s pressure range is 3,357 to 5,877 psia, so that difference is never reached. Physically, the deck is asking for a sealed fault.
What was measured
Section titled “What was measured”Cross-fault flow on LM_F24 was measured directly from the restart files of two runs. The fault carries 36,796 face records and 14,481 active cell pairs.
Run A: MULTFLT 'LM_F24' 0 | Run B: original THPRESFT | |
|---|---|---|
| Cross-fault gas flow, step 100 | 0 | 40 Mscf/d |
| Cross-fault gas flow, step 545 | 0 | 2,600 Mscf/d |
| Mean pressure jump across fault, step 545 | 1,706 to 2,106 psi | 662 to 1,657 psi |
Run B shows flow across faces where the pressure difference is a few hundred psi, far below the 7,252 psi threshold. The threshold was not sealing the fault in that run.
The cause is a known handling issue for stair-stepped corner-point faults, in which the two cells either side of a fault face can both be listed in the same fault’s face records and are then treated as interior to the fault rather than across it. For LM_F24, 6,287 of the 14,481 active face pairs, 43.4%, are affected. A fix is in preparation.
Consequence for this study
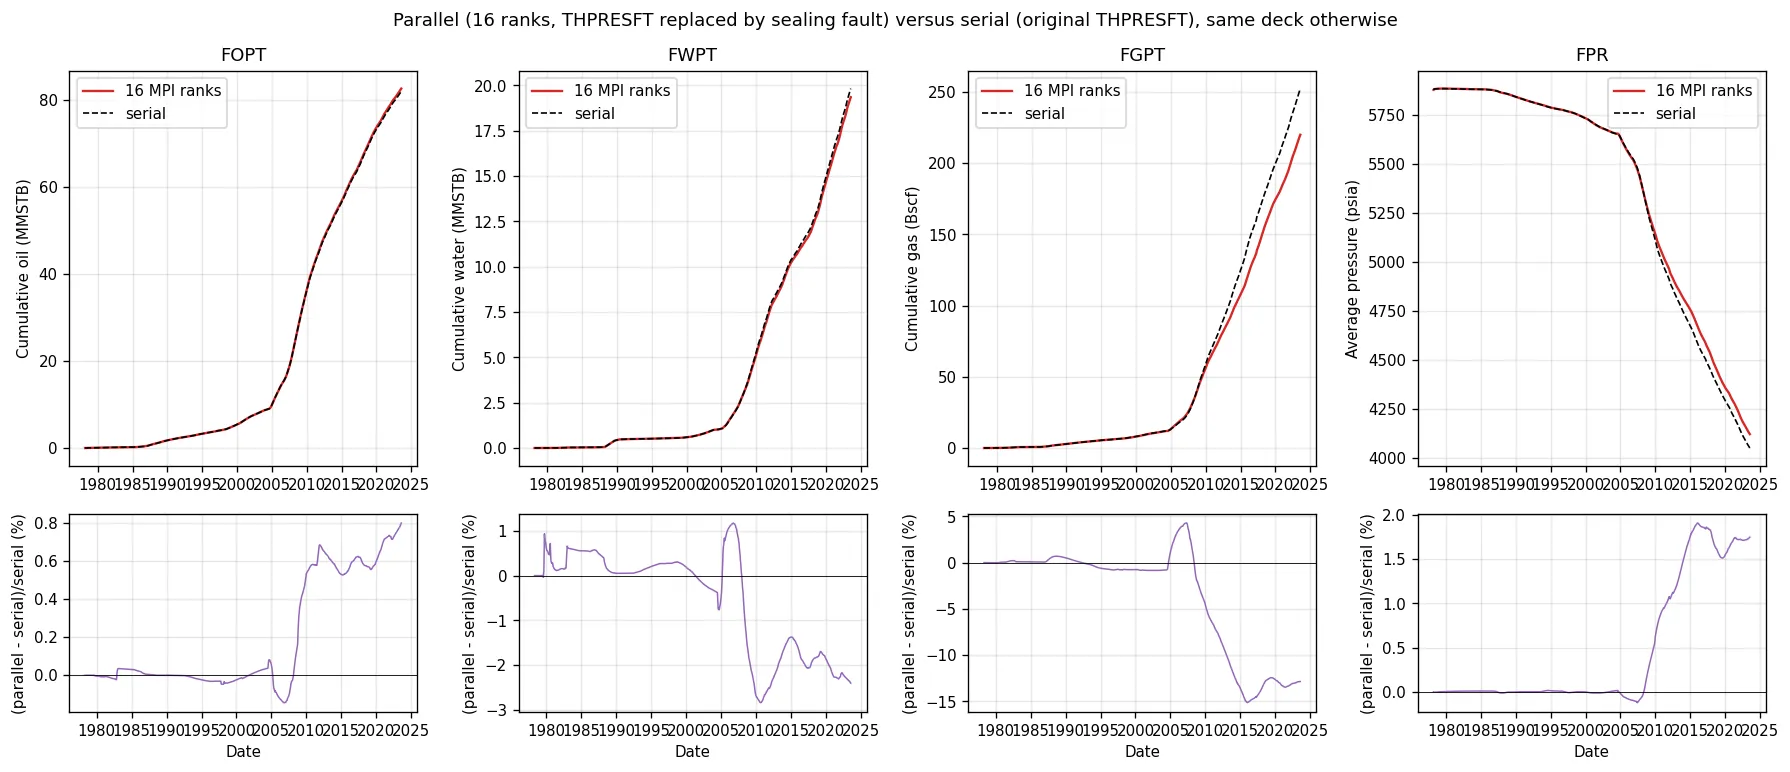
Section titled “Consequence for this study”Run A, which seals the fault outright, reproduces exactly what a 7,252 psi threshold means in this pressure range, with zero cross-fault flow. Run A is therefore the run reported in sections 1 to 7, and its results stand.
The two runs agree to within 0.1% on every field quantity until 2005, which is a valid consistency check over 27 years of history. They diverge afterwards, as the compartments deplete and the pressure difference across LM_F24 grows:
| Quantity at 2023-08-01 | Run A, sealed fault | Run B | Relative difference |
|---|---|---|---|
| Cumulative oil, MMSTB | 82.62 | 81.96 | +0.80% |
| Cumulative water, MMSTB | 19.35 | 19.82 | −2.40% |
| Cumulative gas, Bscf | 220.0 | 252.4 | −12.85% |
| Average pressure, psia | 4,120 | 4,049 | +1.75% |
The 12.9% gas difference is the value of getting this fault right: a leaking LM_F24 lets gas migrate out of the depleted compartments, and the reported gas recovery changes by an eighth.
9. Verification status
Section titled “9. Verification status”| Established | Not yet established |
|---|---|
| The deck parses, initialises and runs the full history to completion | Agreement with ECLIPSE on any quantity |
| Mass balance closes; fluids in place track the cumulatives throughout | Sensitivity to the PVDG viscosity edit, expected nil |
| Two independent runs agree to 0.1% over 27 years of history | Whether ECLIPSE seals all 36,796 faces of LM_F24 |
| The sealed-fault substitution is exactly equivalent to the deck’s intent, with zero cross-fault flow measured |
The ECLIPSE comparison is the single most valuable next step. The earlier ECLIPSE attempt on this deck failed only on the parallel-options licence feature; the data check itself passed and the case was reported valid. Removing the PARALLEL keyword and running serially should produce the reference.
10. Recommended next steps
Section titled “10. Recommended next steps”- Obtain the ECLIPSE reference. Delete
PARALLELfrom the original deck and run serially on the licensed machine. Compare FOPT, FWPT, FGPT, FPR and the BHP of the ten highest-producing wells. This converts every number in this report from internally consistent to validated. - Look at the undrilled north-east structure. Section 5 shows oil saturation of 0.5 to 0.7 on a structure that carries no wells, adjacent to compartments that are heavily depleted. Whether it is in pressure communication with the drilled area is a question the existing model can answer.
- Reduce restart output to yearly and re-run to produce a deliverable output set under 2 GB.
- Prepare an upscaled version if many history-matching iterations are planned.
Appendix: figure index
Section titled “Appendix: figure index”All figures are in LM_HM116_results/, generated directly from the run’s own output files.
| File | Content |
|---|---|
fig0_structure_wells.png | Structure map with well locations |
fig1_field_rates.png | Field oil, water and gas rates |
fig2_field_cumulatives.png | Cumulative production, water cut and GOR |
fig3_pressure_inplace.png | Average pressure and fluids in place |
fig4_parallel_vs_serial.png | Run A versus Run B, four quantities with relative differences |
fig5_wells_cumulative.png | Cumulative oil by well, all 69 |
fig6_top_wells.png | Oil rate and BHP for the top eight wells |
fig7_performance.png | Time stepping, iteration counts, wall-time breakdown |
fig8_map_first.png | Pressure and saturation maps at initialisation |
fig8_map_last.png | Pressure and saturation maps at 2023-08-01 |
anim_pressure_saturation.gif | 56-frame animation over the full history |